


Mercato azionario spagnolo. Una buona ripresa: moderato ottimismo degli analisti
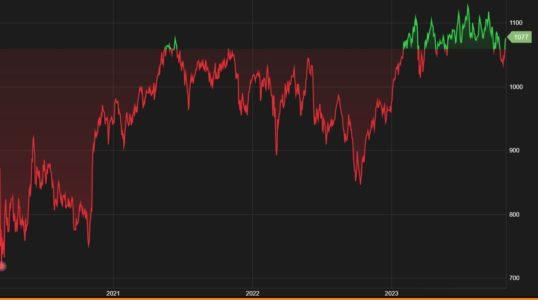
Si sta concentrando sulla Spagna l’interesse di alcuni analisti sull’andamento del mercato azionario. In effetti gli ultimi anni sono stati decisamente positivi, a partire dai mesi successivi al lockdown del 2020. Qui sotto l’andamento dell’indice Morningstar
I quotidiani spagnoli non mancano di sottolineare come alcuni titoli siano sottovalutati rispetto alle loro valutazioni.
Già da qualche tempo il quotidiano Expansiòn sottolinea come gli investimenti indiretti nell’intelligenza artificiale passino attraverso settori come la sanità, i trasporti, la finanza o la distribuzione. Nvidia è il centro del boom, con una posizione quasi monopolistica nelle tecnologie chiave. L’intelligenza artificiale (AI) è la megaforza per gli investitori di questo secolo, secondo il quotidiano spagnolo. Ha la capacità di penetrare e modificare il funzionamento di una moltitudine di settori economici e dei titoli delle società quotate ad esso direttamente o indirettamente collegate.
Oggi ancora Expansion torna a segnalare alcuni titoli che a livello europeo dovrebbero creare grandi soddisfazioni per gli investitori. Qui sopra come titola il quotidiano oggi.
Altra fonte di informazioni è Buffett.
Buffett Indicator: Spain Stock Market Valuations and Forecasts
Updated at Fri, 03 Nov 2023 20:30:07
According to the original Buffet Indicator, the Stock Market is Modestly Undervalued.
Ratio of total market cap over GDP: Recent 20 Year Maximum – 126.48%; Recent 20 Year Minimum – 39.85%; current – 54.06%
Expected future annual return: 9.3%
Based on the newly introduced total market cap over GDP plus Total Assets of Central Bank ratio, the Stock Market is Significantly Undervalued.
Ratio of total market cap over GDP plus Total Assets of Central Bank: Recent 20 Year Maximum – 110.25%; Recent 20 Year Minimum – 22.38%; current – 31.24%
Modified expected future annual return: 12.7%
ETF Used for dividend yield: EWP (Yield=2.62%)
Market Index used: IBEX 35
Current Annual GDP: $1,427 billion US dollars or 1,329 in billions of national currency (GDP in Local Current Prices Annual Growth=2.88%)
Current Total Asset of Central Bank: $1,042 billion US dollars or 970 in billions of national currency
Data since year 1993
Spain Historical GDP Growth
Historical GDP of Spain in billions of national currency. The GDP in local current prices has grown at the annual rate of 2.88% over the past 8 years. Please note this growth rate includes the effect of price inflation and it is NOT the real GDP growth rate. Current Annual GDP: $1,427 billion US dollars or 1,329 in billions of national currency.
Spain GDP
1328.92Spain GDP (Billion, National Currency)
Historical Stock Market Cap
Historical total market of Spain in billions of national currency. This value is normalized using the data published by WorldBank. IBEX 35 is used for the normalization. It is a market capitalization weighted index comprising the 35 most liquid Spanish stocks traded in the Madrid Stock Exchange General Index.
Spain Total Market Cap
718.355 Spain Total Market Cap (Billion, National Currency)
Historical Total Assets of Central Bank
Historical Total Assets of Central Bank of Spain in billions of national currency, which is obtained from each country’s central bank balance sheet. Please be aware that if the total assets is displayed as zero or – , it suggests that there’s no data available rather than the original data being zero. In this case, the modified version of both the ratio and projected annualized market return will be treated the same as the original version.
Spain Total Assets of Central Bank
970.36 Spain Total Assets of Central Bank (Billion, National Currency)
Original and Modified Historical Ratio of Total Market Cap over GDP (%)
The current ratio of total market cap over GDP for Spain is 54.06%. The recent 20 year high was 126.48%; the recent 20 low was 39.85%. If we assume that the ratio will reverse to the recent 20 years mean of 73.03% over the next 8 years, the contribution to expected annual return is 3.83%.
Based on the modified version, the current TMC / (GDP + Total Assets of Central Bank) Ratio for Spain is 31.24%. The recent 20 year high was 110.25%; the recent 20 low was 22.38%. If we assume that the ratio will reverse to the recent 20 years mean of 54.6% over the next 8 years, the contribution to expected annual return is 7.23%.
Spain Original and Modified Ratio of TMC over GDP (%)
Based on these historical valuations, we have divided market valuation into five zones:
| Ratio = Total Market Cap / GDP | Valuation |
|---|---|
| Ratio ≤ 51% | Significantly Undervalued |
| 51% < Ratio ≤ 66% | Modestly Undervalued |
| 66% < Ratio ≤ 80% | Fair Valued |
| 80% < Ratio ≤ 95% | Modestly Overvalued |
| Ratio > 95% | Significantly Overvalued |
| Where are we today (2023-11-04)? | Ratio = 54.06%, Modestly Undervalued |
Based on these modified historical valuations, we have divided market valuation into five zones:
| Ratio = Total Market Cap / (GDP + Total Assets of Central Bank) | Valuation |
|---|---|
| Ratio ≤ 38% | Significantly Undervalued |
| 38% < Ratio ≤ 49% | Modestly Undervalued |
| 49% < Ratio ≤ 60% | Fair Valued |
| 60% < Ratio ≤ 71% | Modestly Overvalued |
| Ratio > 71% | Significantly Overvalued |
| Where are we today (2023-11-04)? | Ratio = 31.24%, Significantly Undervalued |
Predicted and Actual Returns
From the equation presented on the U.S. market valuation page,
Investment Return (%) = Dividend Yield (%) + Business Growth (%) + (Re/Rb)(1/T)-1
We can compute the predicted and actual returns of the Spain stock market over a given time period, T. In the calculation, we set T to equal eight years, the approximate length of a full economic cycle. The calculated results are presented in the chart below.
The Predicted Return line indicates the expected, or predicted annualized return for the next eight years if the current TMC / GDP ratio reverts to its recent 20 years mean of 73.03%.
The Modified Predicted Return line indicates the expected, or predicted annualized return for the next eight years if the current TMC / (GDP + Total Assets of Central Bank) ratio reverts to its recent 20 years mean of 54.6%.
The Actual Return line indicates the actual, annualized return of the Spain stock market over eight years. We use “IBEX 35” to do the actual return calculation. We can see the calculations largely predicted the trend in the stock market as the actual return line is closely parallel to the two predicted return lines.
Predicted and Actual Returns of Spain
9.3312.73-0.17Predicted Return
Conclusion
Under the original buffett indicator, the stock market of Spain is expected to return 9.3% a year for the coming years. This is from the contribution of economic growth in local current prices: 2.88%, Dividend Yield: 2.62% and valuation reverse to the mean 3.83%.
Under the modified model, the contribution of economic growth and dividend yield stays the same while the valuation reverse to mean changes to 7.23%. Consequently, the stock market of Spain is expected to return 12.7% a year.
This is the projected return and the modified projected return of the stock market in Spain relative to other countries. Click on the country on the right sidebar to check out the details for each country.
Our Fact Checking Process
We prioritize accuracy and integrity in our content. Here's how we maintain high standards:
- Expert Review: All articles are reviewed by subject matter experts.
- Source Validation: Information is backed by credible, up-to-date sources.
- Transparency: We clearly cite references and disclose potential conflicts.
Our Review Board
Our content is carefully reviewed by experienced professionals to ensure accuracy and relevance.
- Qualified Experts: Each article is assessed by specialists with field-specific knowledge.
- Up-to-date Insights: We incorporate the latest research, trends, and standards.
- Commitment to Quality: Reviewers ensure clarity, correctness, and completeness.
Look for the expert-reviewed label to read content you can trust.

 VIDEO INTERVISTE
 Motori
 REAL ESTATE
 LMF crypto
 LMF food
 LMF private markets
 LMF arte
 Legal
Legal LMF green